AVC Stats

As I’ve been working on a new design and approach to this blog/newsletter, I have been diving into the analytics to understand what all of you are doing with it.
Here are some charts and tables:
1/ The web traffic (desktop and mobile) has risen and fallen over the years, driven by SEO and other factors. MAUs peaked in the 2012/2014 period in the 300k range. It has settled in more recently at 80-100k a month.

2/ The email “newsletter” subscriptions have risen a lot in recent years. For much of AVC’s history, email was not a particularly popular way to read this blog, but in the last four or five years, it has grown a lot, to about 30k active email readers.

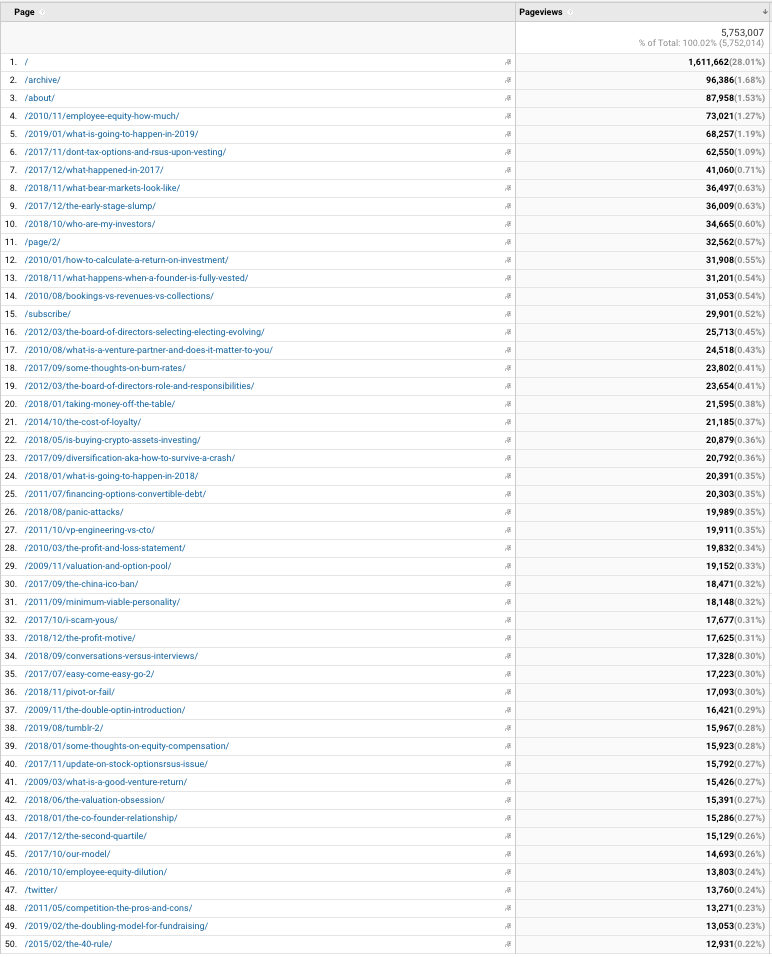
The top 50 blog posts of all time are an interesting bunch. Most of them have been written in the last five years, but there are a few that go back to 2009 and 2010.

Clearly there is a lot of value in the archive and I want to flesh that (and search) a lot more in the redesign.
It also want to make the email subscription work better. I have heard from many who read via email that it could be improved. So I will work on that.


