Visualizing Kickstarter
A visual data company company called Polygraph looked at over 100,000 Kickstarter projects in the US and wrote a really cool blog post about them.
This table shows the different character of the biggest cities on Kickstarter:
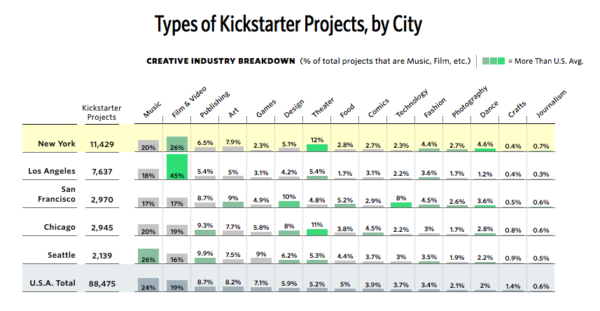
- NYC over indexes for film, theater, and dance.
- LA over indexes for film in a big way.
- SF over indexes for art, design, and tech.
- Chicago over indexes for publishing and theater.
- Seattle over indexes for music, publishing, design, and theater.
Even more fun are the bubble charts that they created for all of the major locations on Kickstarter:
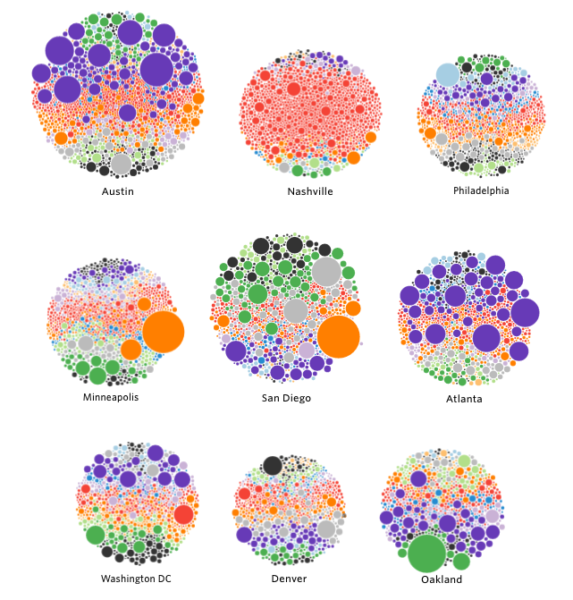
Nashville is almost all red because its a music city. Atlanta produces some huge game projects.
You can learn some interesting things.
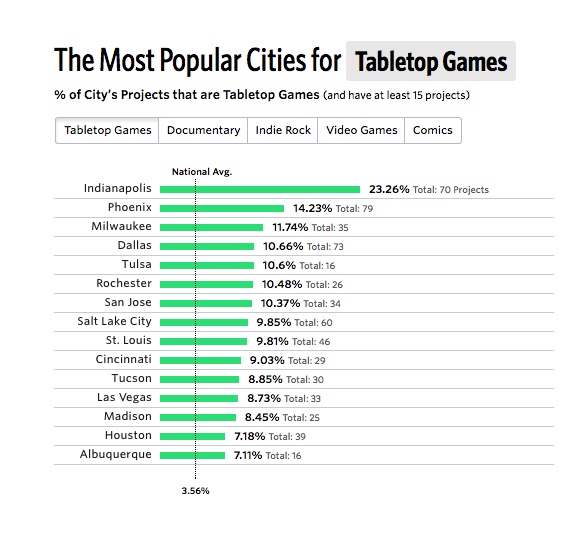
Here are the places that over index for table top games:
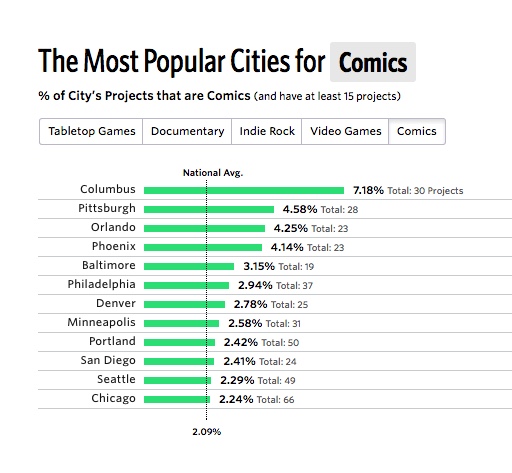
And here are the places that over index for comics:
The Polygraph blog post is super interactive (unlike this post) and if you want to dig into the data, you can do it there.
Creativity is alive and well all over the world and you can learn a lot about it by studying what goes on on Kickstarter.


