More S1 Fun
I am continuing my mini series on reading S1s (IPO documents). We are enjoying an IPO bonanza this year, so we might as well use it for some good and learn something.
When a company files for an IPO, I like to think if there is a publicly traded company that looks a lot like that company and if so, I lik to run some numbers comparing the two.
Well we have that exact situation with Uber filing to go public last week. Here is Uber’s S1.
We can compare Uber’s numbers to recently public Lyft, which I blogged about earlier in this S1 Fun series.
Here are Uber’s profit and loss numbers from their S1:

We can compare this to Lyft’s profit and loss from my prior blog post:

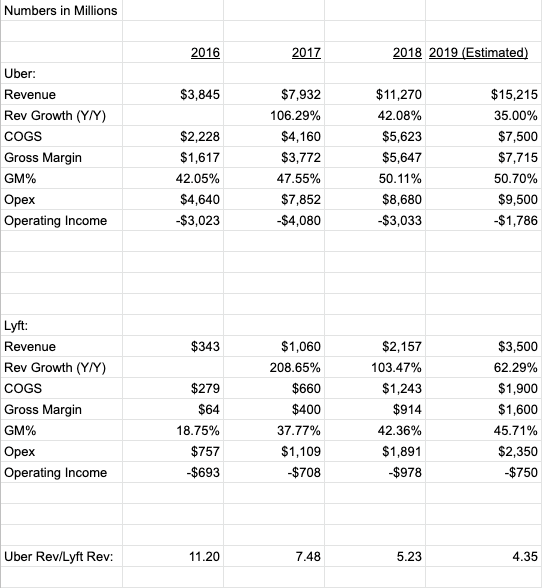
I put all of these numbers into a spreadsheet and added some estimates for 2019 that are nothing more than back of envelope guesstimates.

What you can see from this is that Uber is 4-5x larger than Lyft, growing a lot more slowly, has slightly better gross margins, and both are still losing a lot of money but both are moving towards getting profitable on operations in a few years.
Finally lets look at market valuations. Lyft is currently trading at a market cap of $17bn. If you say that Uber is 4-5x larger than Lyft, then Uber ought to be worth in the range of $70bn to $85bn.
There are other factors that will be in play when Uber eventually prices their IPO and trades. Uber owns minority interests in a number of other ridesharing businesses that could be worth as much as $10bn of additional value. On the other hand, Lyft is growing more quickly than Uber.
Ultimately we will see how the market values Uber. But from this analysis, and the public market comparables from Lyft, we can see that Uber should be worth quite a bit when it goes public.


