Check In Apps vs Audience Measurement Panels
I spent a decade as an early stage investor and board member of comScore. In that capacity I learnt a lot about using representative samples to develop broad based market research on media viewing. This is the approach used by Nielsen in television and comScore in internet. Both companies assemble representative panels of users and then scale up the data to predict media viewing at large. There is a lot of data science involved in this approach. Both companies have built large and valuable franchises with this technique.
Yesterday, I came across a blog post by our portfolio company Get Glue where they correlated their "checkin data" with film box office results. For those that don't know, Get Glue is the most popular entertainment checkin app for mobile and web. Get Glue has well over a million users and had over 4 million entertainment checkins in April. So the question is – can a checkin app be a representative sample for the purposes of measuring and predicting entertainment product performance?
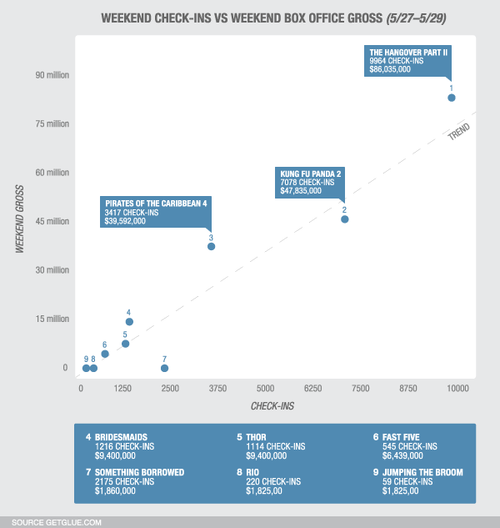
Here's a chart of checkins vs. box office results:
Get Glue goes on to explain the math behind this graph:
As you can see, there is a clear correlation between check-ins and box office dollars. The gray dotted line represents the average relationship between the two. For the mathematically inclined, to get the trend line we performed a simple linear regression and obtained an R2 value of 0.95. In other words, 95% of the variance in the data was explained by the trend line. A perfect correlation would have an R2value of 1.0.
I think this is fascinating. Get Glue also gets checkins to TV shows and music listening. It occurs to me that they could, with a fair bit of targeted recruiting and data cleansing, get to a fairly decent audience measurement service. I continue to be amazed by the power of the checkin.


